Salt marshes are among the world’s most valuable ecosystems. They treat waste, provide habitat for marine life, produce food and offer recreation. They are also our key natural defence in the face of climate change and sea level rise. These services are driven by the fact that twice everyday, marshes are submerged by the flooding tide and six hours later, drained by the ebbing tide.
Skidaway Institute professor Jack Blanton and two visiting scientists from the University of Lisbon (Portugal), Francisco Andrade and Adelaide Ferreira, are contributing to the understanding of salt marshes by using aerial surveys to improve the way they are mapped. Research associates from Skidaway Institute, Julie Amft and Mike Robinson, are also participating in the project.
“We all have seen how the tide flows through the meandering network of salt marsh channels, but it is virtually impossible to go in the salt marsh and accurately map the entire channel network and the surrounding vegetated areas,” said Andrade.
Most charts simply show a salt marsh as a flat surface, cut by channels where boats can navigate. However, it is critical for scientists to understand how the marsh functions and evolves.
“To understand a salt marsh, we must know how much estuary-water the tide moves over it together with how the water spreads over the salt marsh and how it retreats,” Andrade said.
The scientists have developed a method that relies on identifying the flooded area of a salt marsh at any given moment using an infrared (IR) aerial photograph. Since IR light is almost completely absorbed by water, the flooded areas show up as dark, as opposed to brighter dry areas. The active green vegetation, whose chlorophyll strongly reflects IR, will show brighter shades. By taking a series of aerial photographs during the course of a tidal cycle, and coupling each corresponding flooded area to elevation data from local tide gauges, scientists can develop a topographical profile of the marsh.

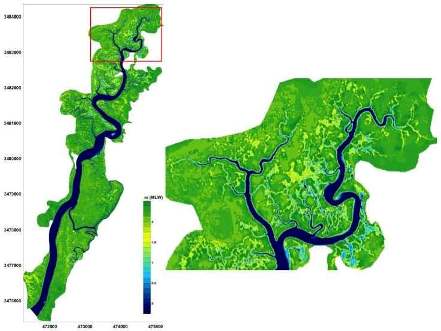
In the left hand image, the digital elevation model for the Duplin River and surrounding marsh. The area in the red box is enlarged in the right hand image.
The team tested their technique in the Duplin estuary, behind Sapelo Island, Ga., by constructing a detailed digital elevation model (DEM) of the entire intertidal area, including all the salt marsh.
“Using the DEM, circulation patterns over the intertidal area and the corresponding water volumes can now be readily evaluated, yielding information on the time material is retained in the marsh,” said Blanton. “Moreover, the high-resolution DEM provides detailed topography required for state-of-the-art hydrodynamic circulation models whose goal is to faithfully represent currents in the tidal channels and over the surrounding intertidal area.”
The scientists are currently testing their new technique by comparing their results with independently measured topographical data. Plans are underway to conduct an additional survey on an ebbing tide. The rate at which the marsh floods compared to the rate at which it ebbs will provide quantitative estimates of water retention as well as ground water discharge.


